
The National Electricity Market
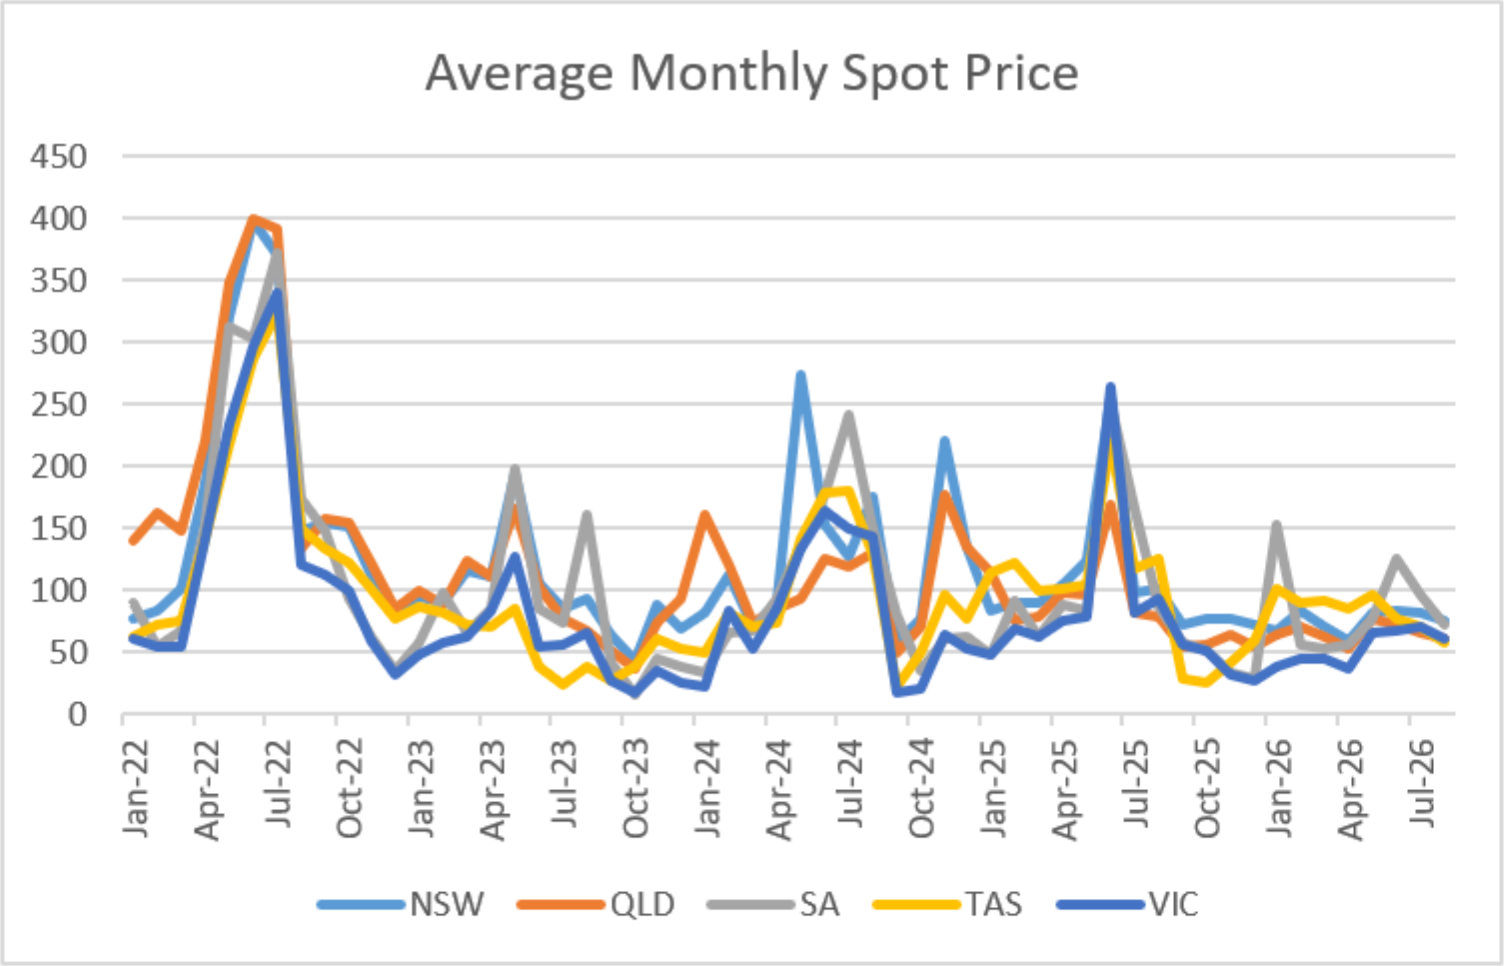
Wholesale electricity prices decreased in all NEM States in August. SA fell the most, down 25% to $72. TAS fell 18% to $58 while VIC fell 14% to $60. QLD and NSW decreased the least, down 8% and 7% respectively. Average prices ranged from $58 in TAS up to $75 in NSW
Electricity Generation Mix
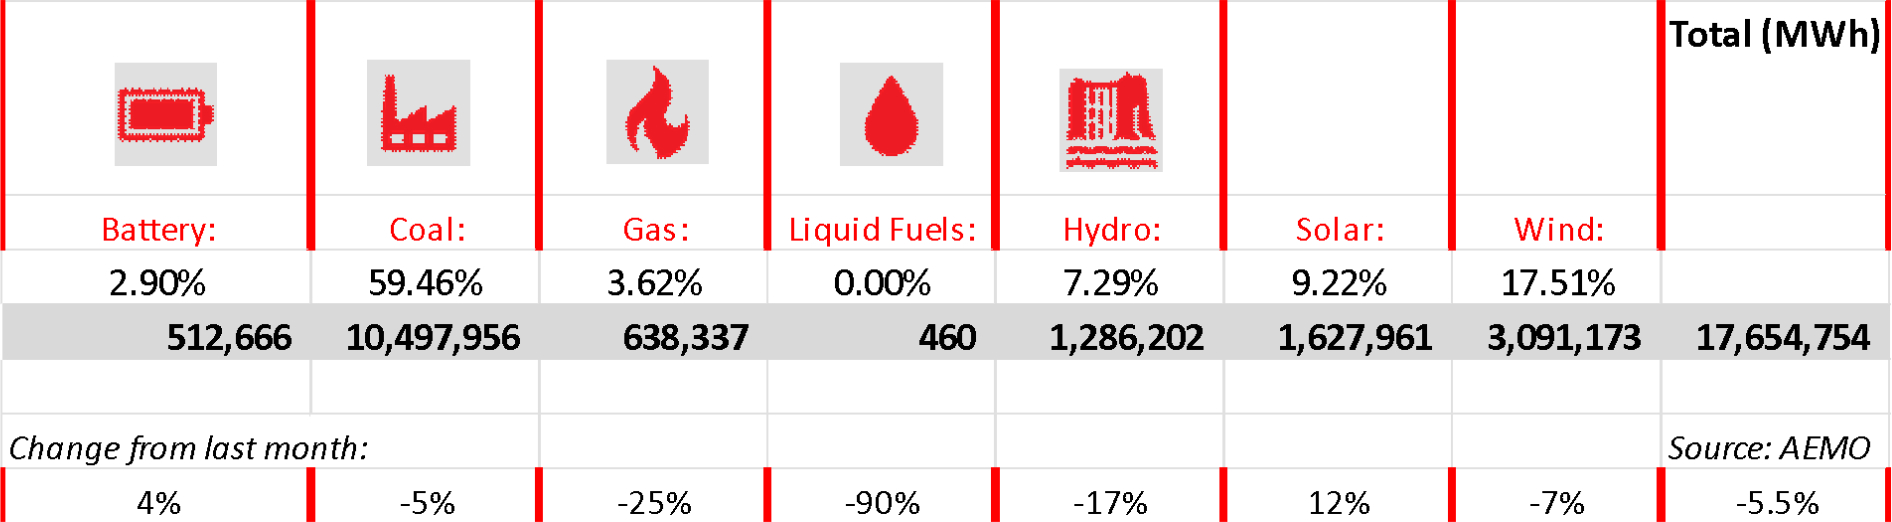
Total grid-scale generation for August decreased by 5.5% from July levels – a significant decrease in operational demand.
All generation types had significant falls apart from Solar which increased 12% compared to last month.
Gas Generation
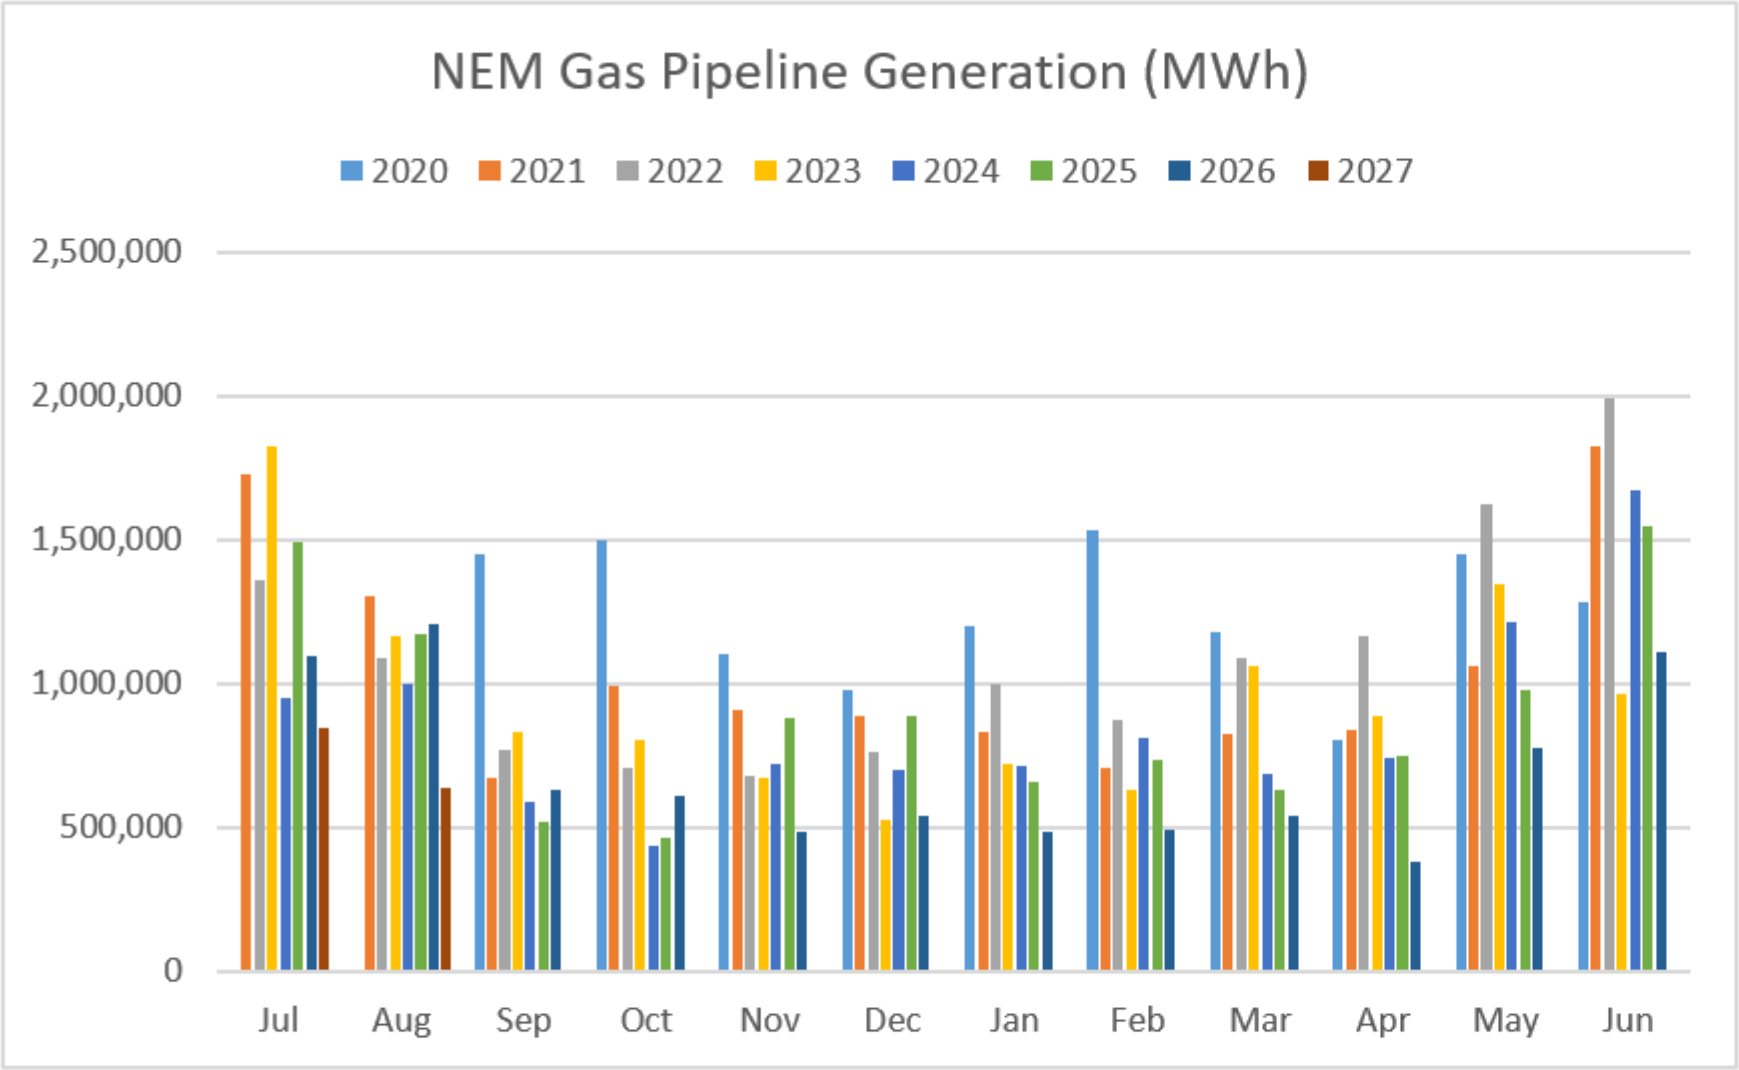
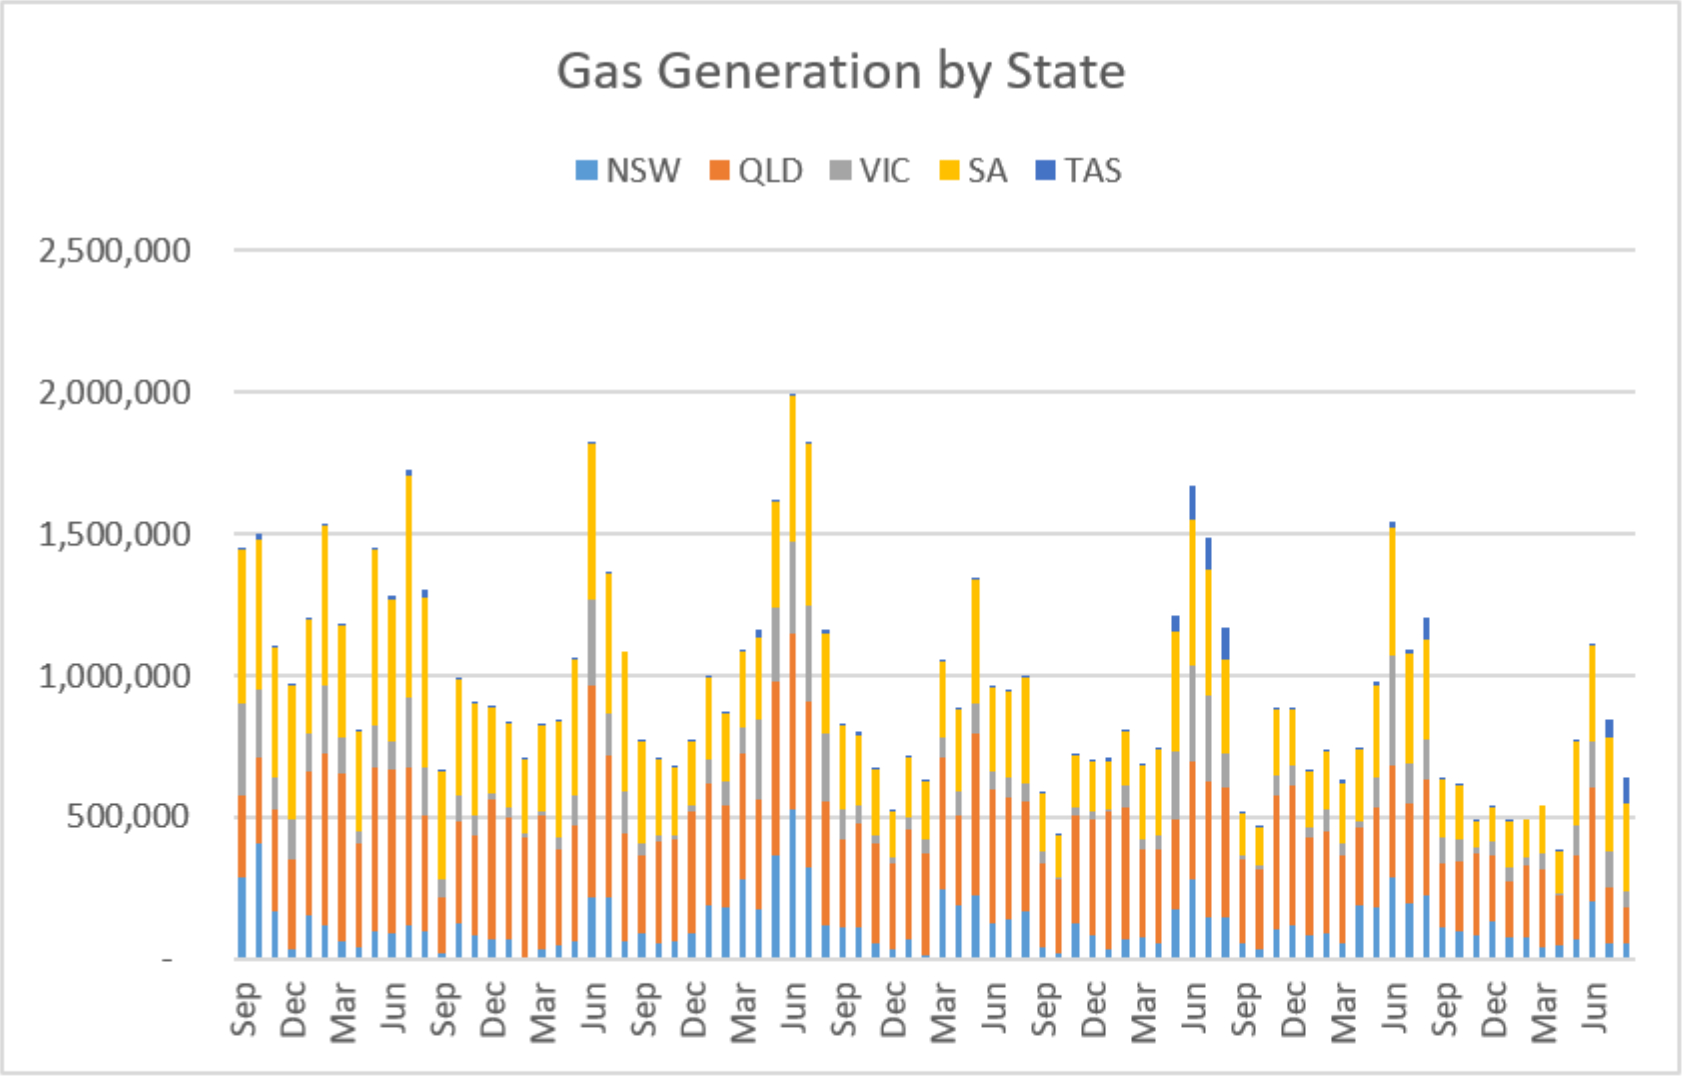
Gas generation decreased in August – down 25% compared to July. Compared to 12 months ago gas generation was 47% lower than it was in August 2025 – almost half the level of any August month in the last 7 years.
Gas generation was down in all States apart from TAS (up 32%). VIC was down 51% while QLD was down 36%, SA 23% and NSW 9%.
Hydro Generation
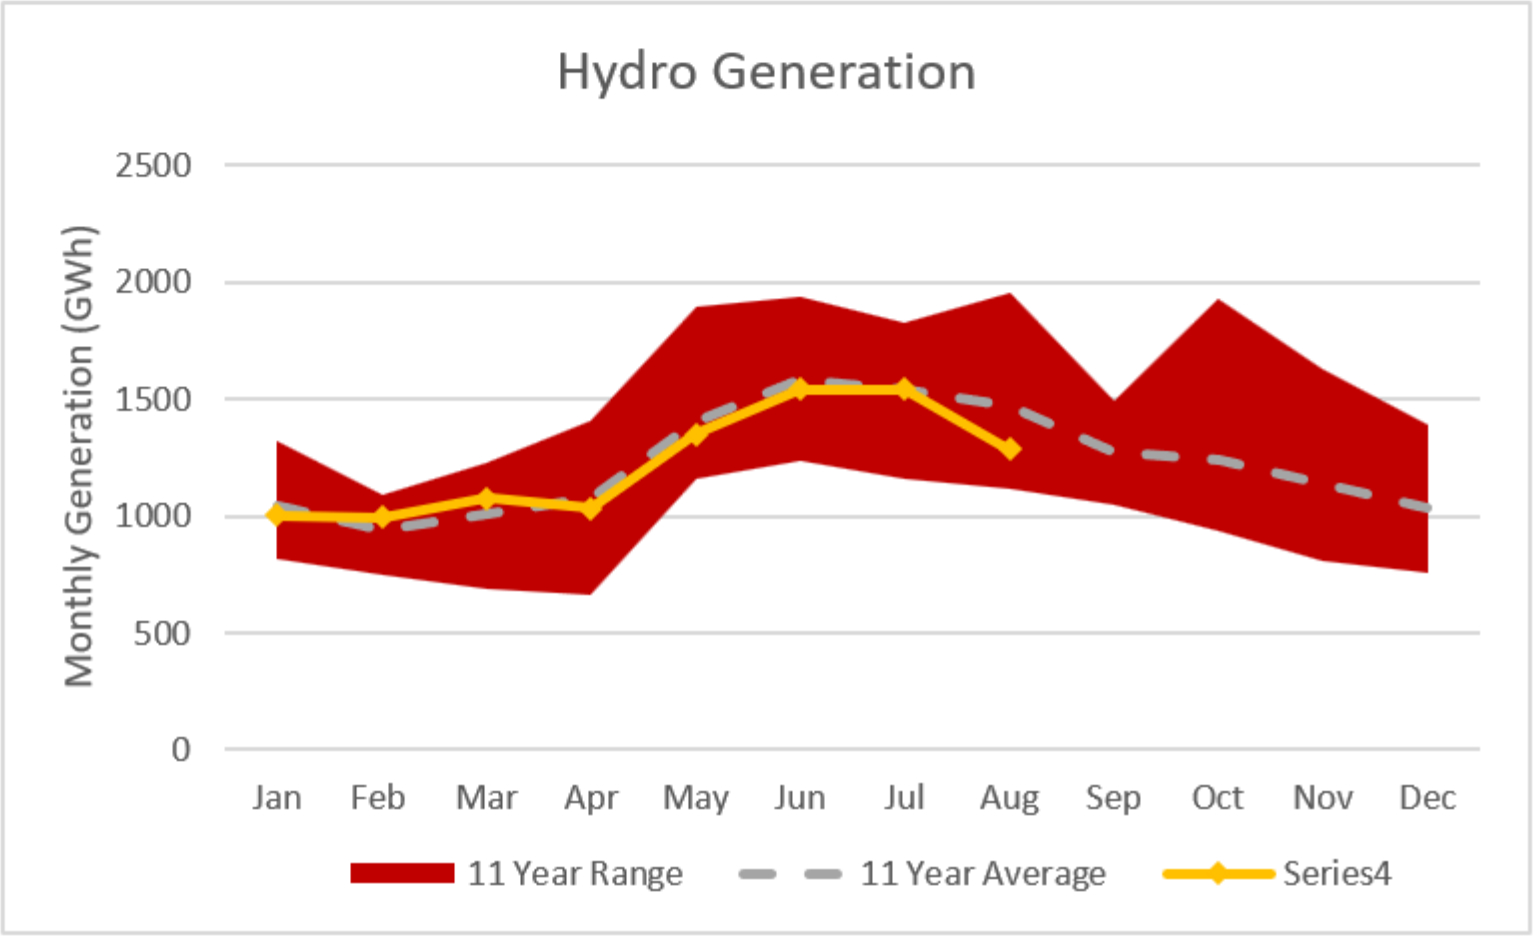
Hydro generation was down significantly in August compared to July levels and well below the average level seen in the last 11 years, for this time of year, as shown below.
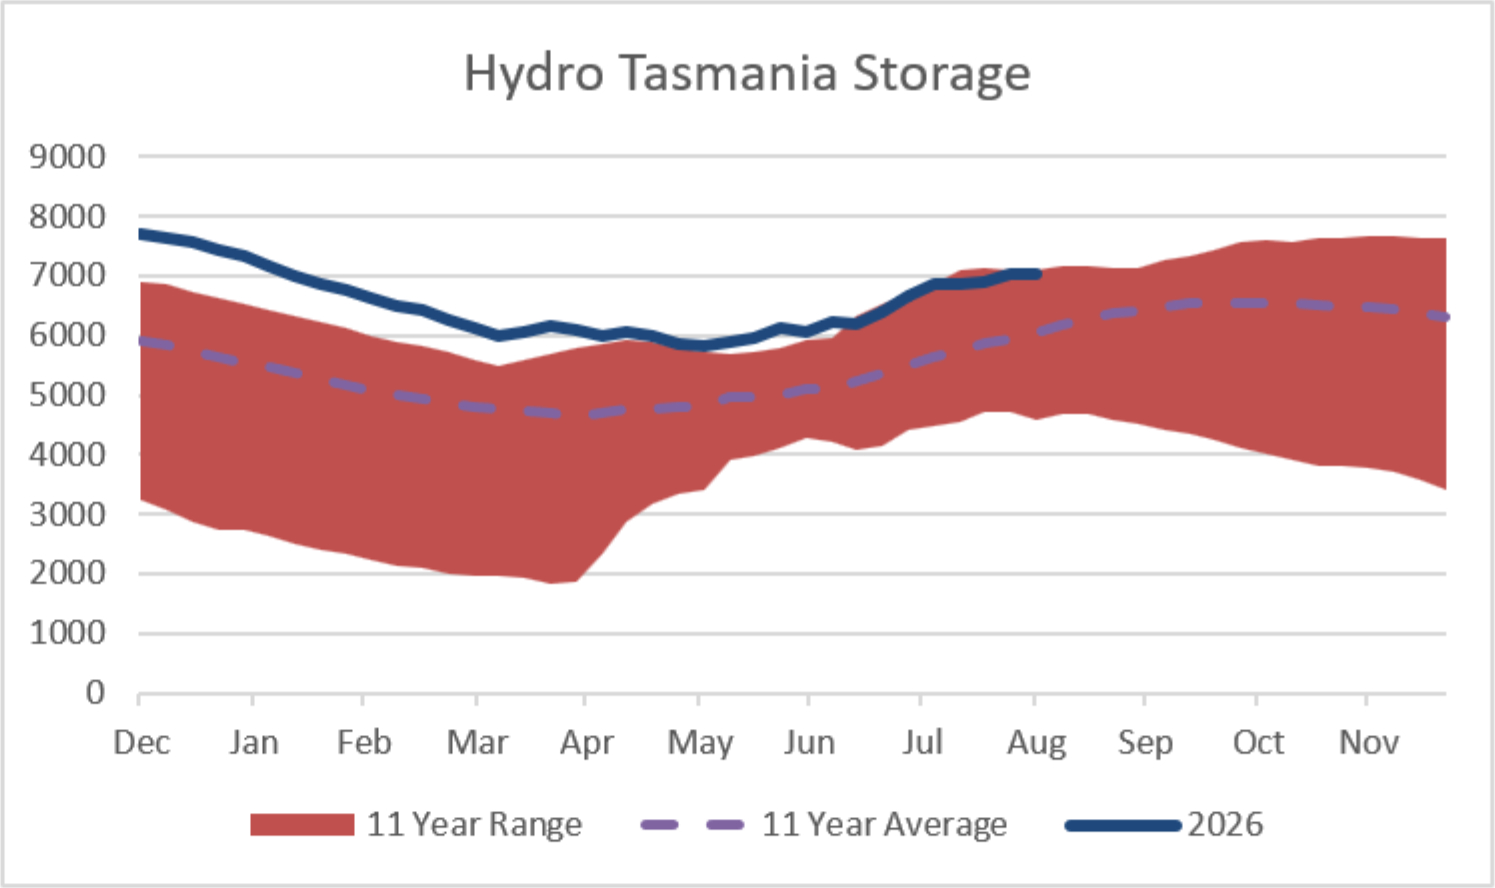
Storage in Hydro Tasmania’s lakes increased again through August. Storage ended the month at 7,044GWh (49% full), an increase of 189GWh over the month. This is 25% more than the same time last year and close to the maximum level seen at this time of year in the last 11 years, as shown in the following chart.
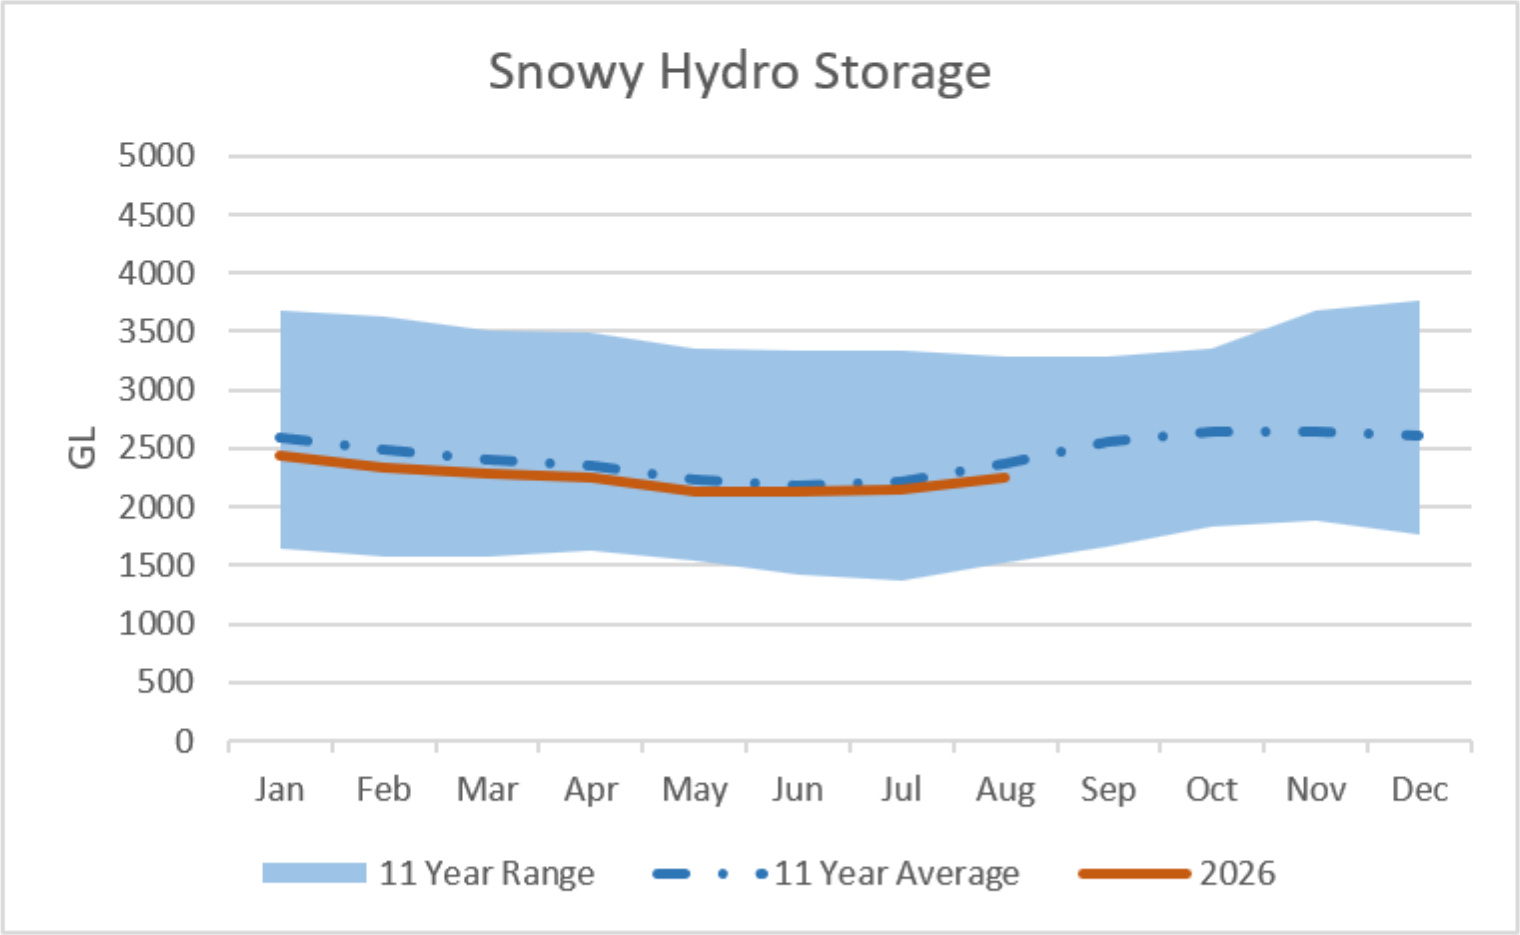
Snowy Hydro’s storage increased through August. Snowy finished the month 42% of full (2,250Gl) – a 4.5% increase over the month. Levels remain close to the 11-year average for this time of year as shown in the following chart.
Climate outlook overview (from BOM)
The long-range forecast for September to November shows:
- Rainfall is likely to be below average across parts of the south and east and above average across much of the western half of Australia.
- Daytime temperatures are likely to be above average south of the tropics.
- Overnight temperatures are likely to be above average for most of Australia.
New Renewable Generation (Excluding Hydro)
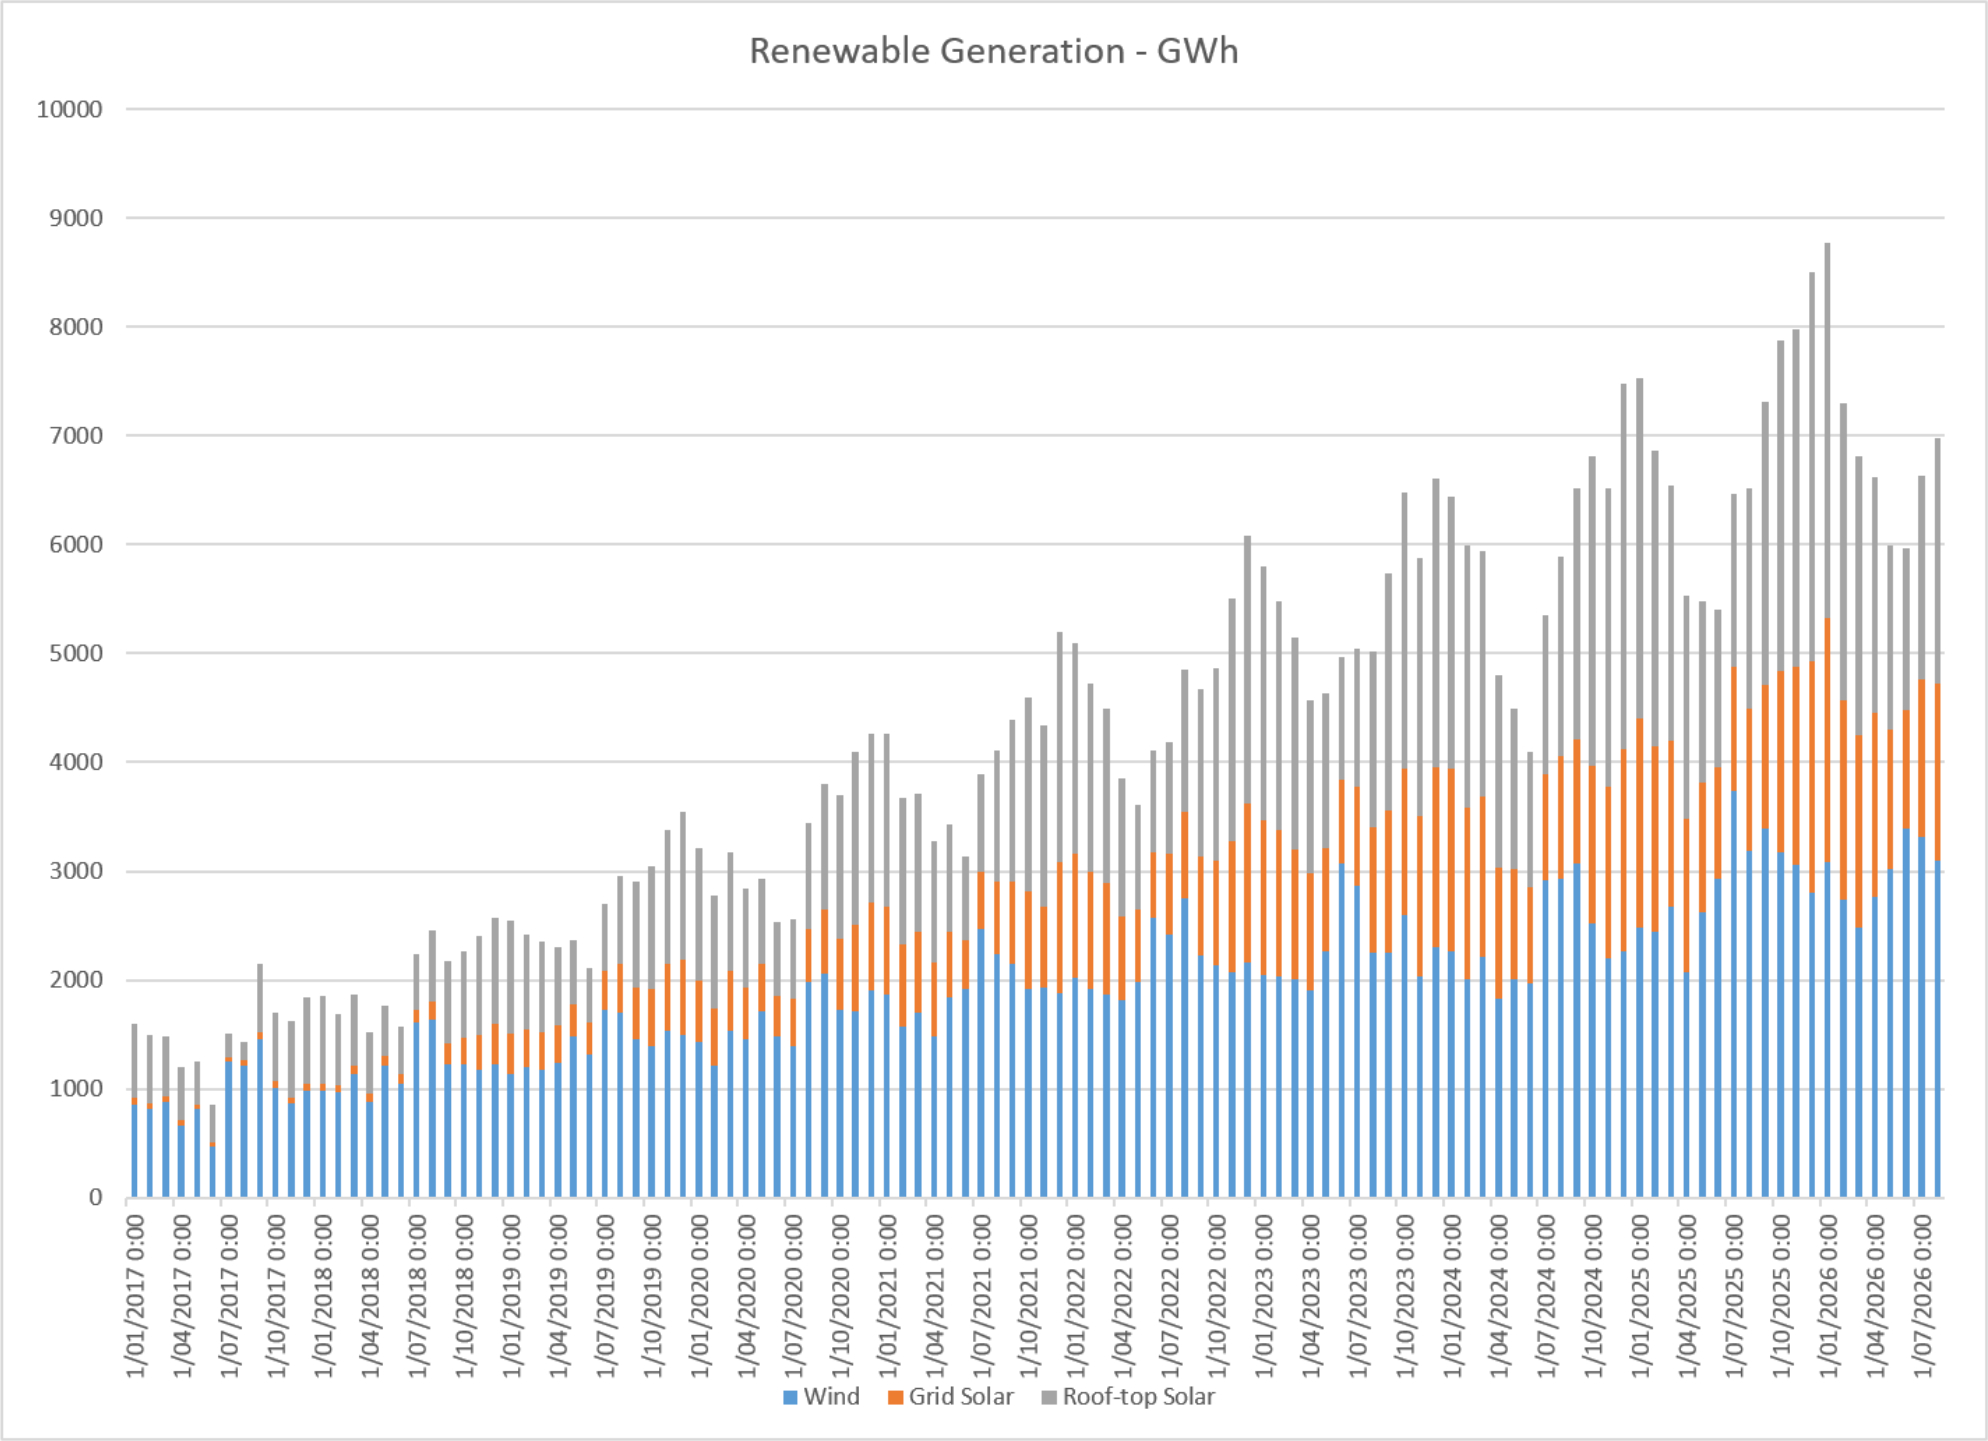
Total renewable generation (wind and solar, including roof-top solar) in August was 6,983GWh – an increase of 5% from last month’s level and 7% above the same month last year. Wind generation was down 7% from last month’s level and 3% below August 2025. Utility Scale Solar generation was up 12% from July’s level and up 26% over the same month last year.
The following chart shows the monthly energy produced for each of these renewable types since 2017.
The Electricity Futures Market
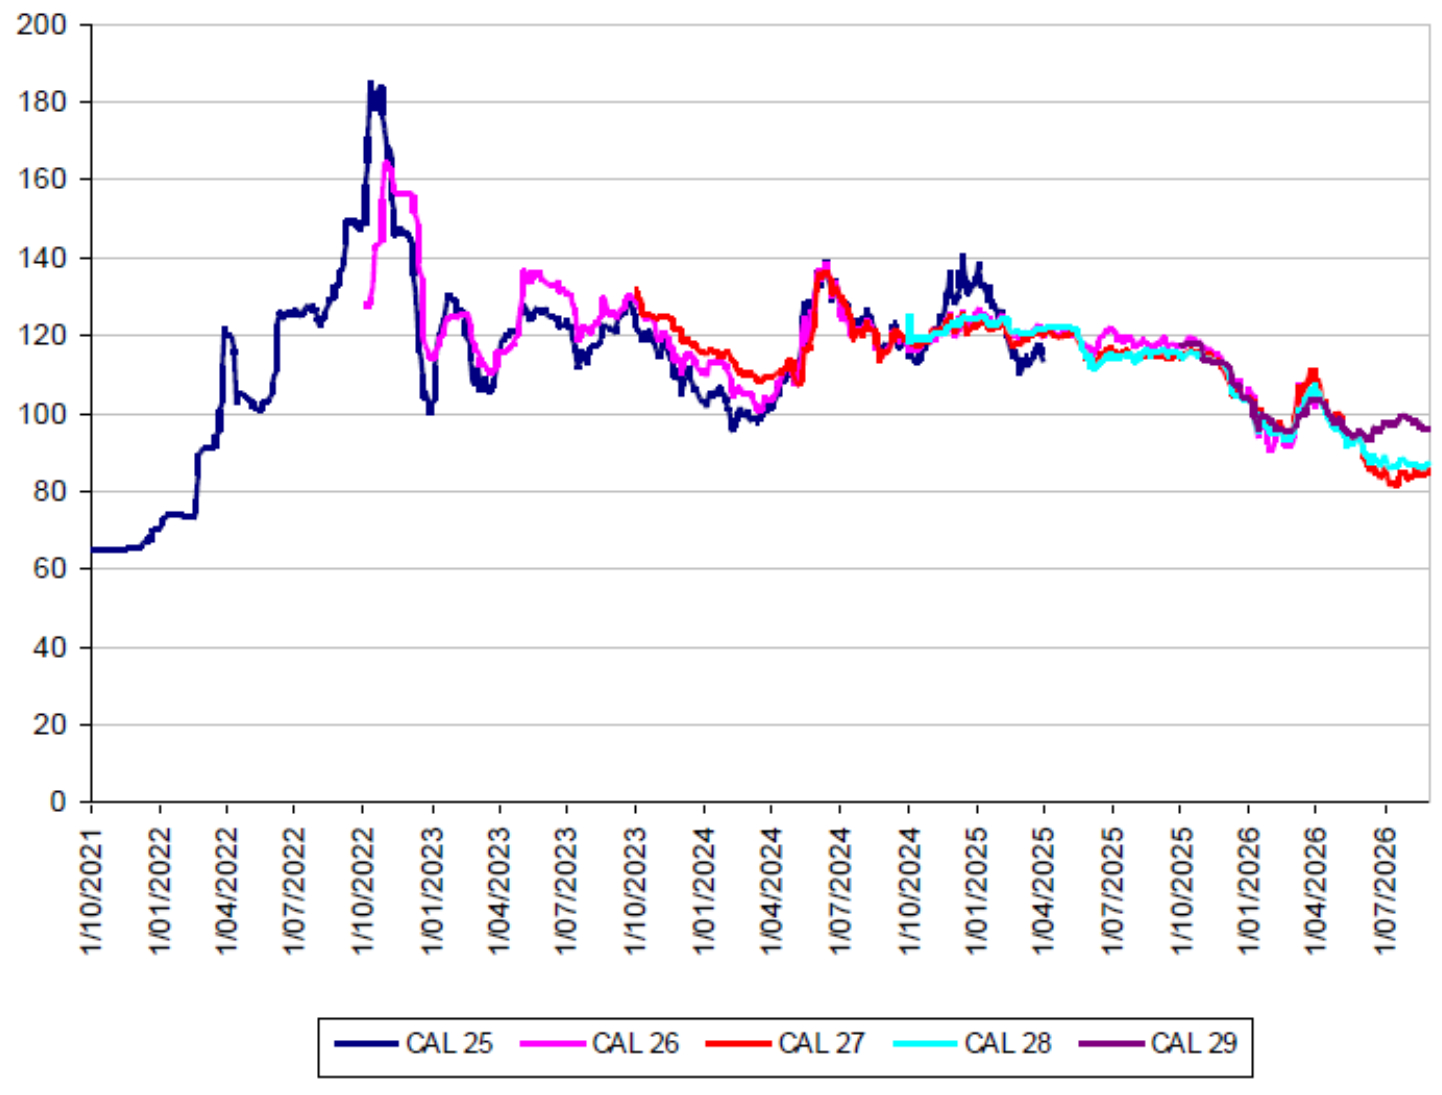
Futures prices mainly increased through August in most States, across most calendar years.
In NSW CAL27 was up 2% at $85. CAL28 was flat at $87, while CAL29 was down 2.5% ending the month at $96.
Calendar Year Contracts for New South Wales
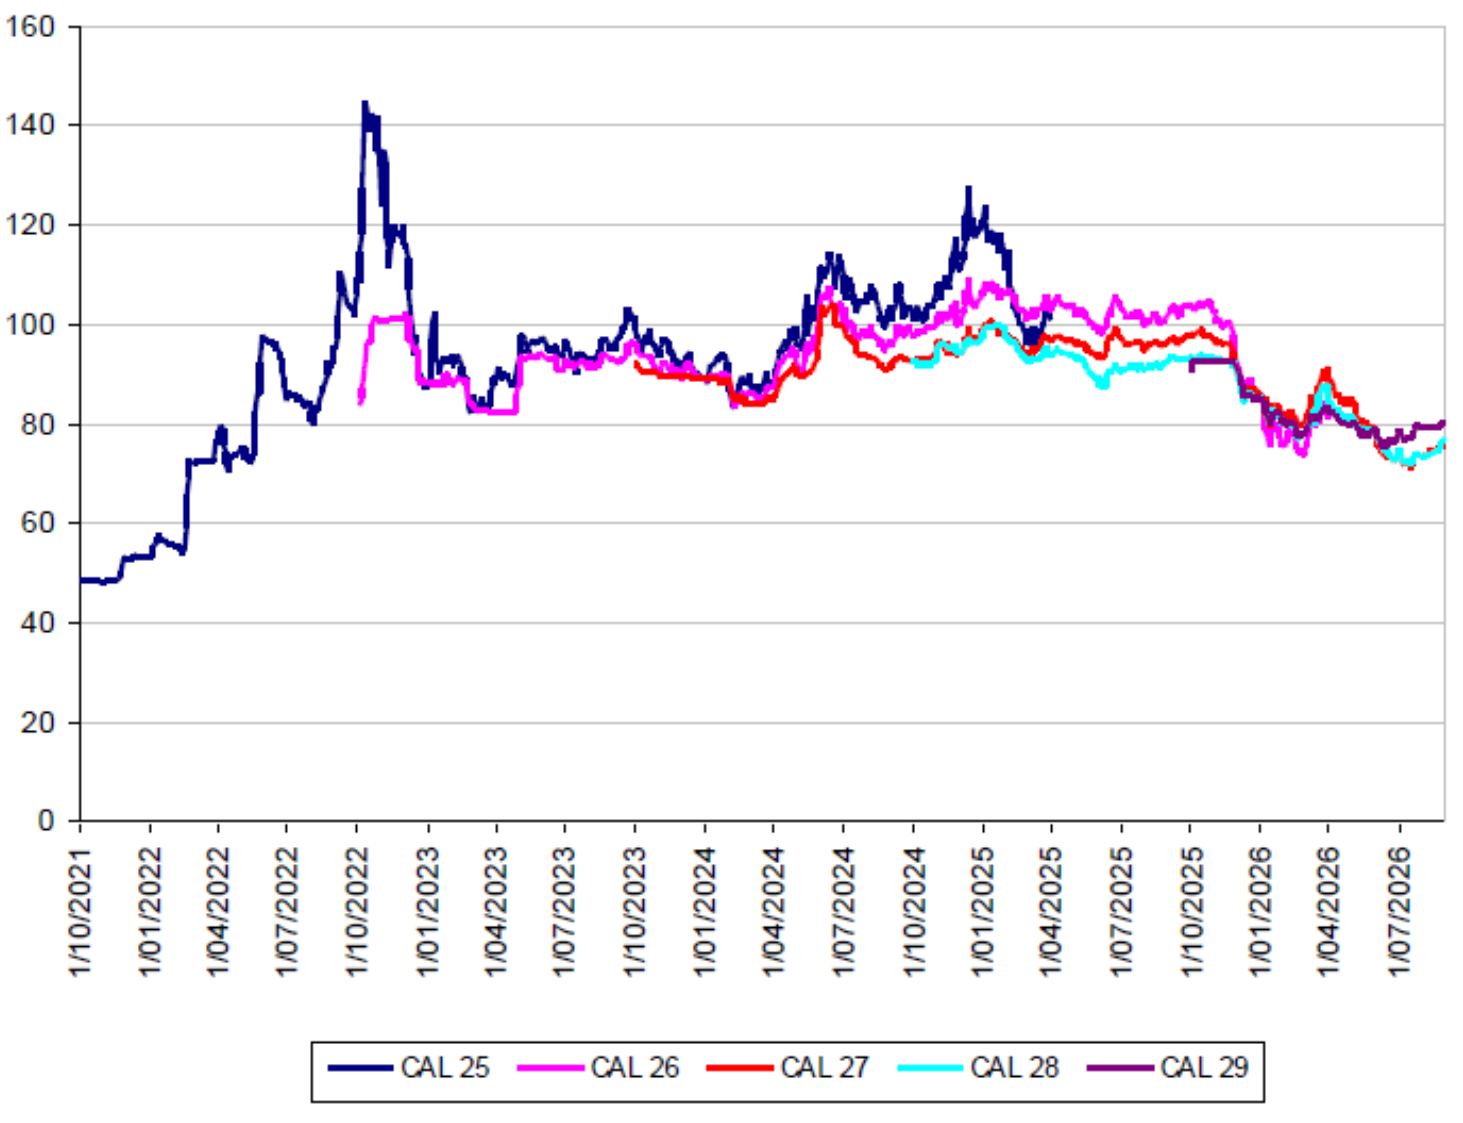
QLD prices in CAL27 were up 3% at $75 while CAL28 was also up 5.5% ($77)). CAL29 ended the month up 2% at $80.
Calendar Year Contracts for Queensland
VIC futures prices for CAL27 increased 2% to $63, while CAL28 was also up 2% at $73. CAL29 ended the month down 1% at $84.
Calendar Year Contracts for Victoria
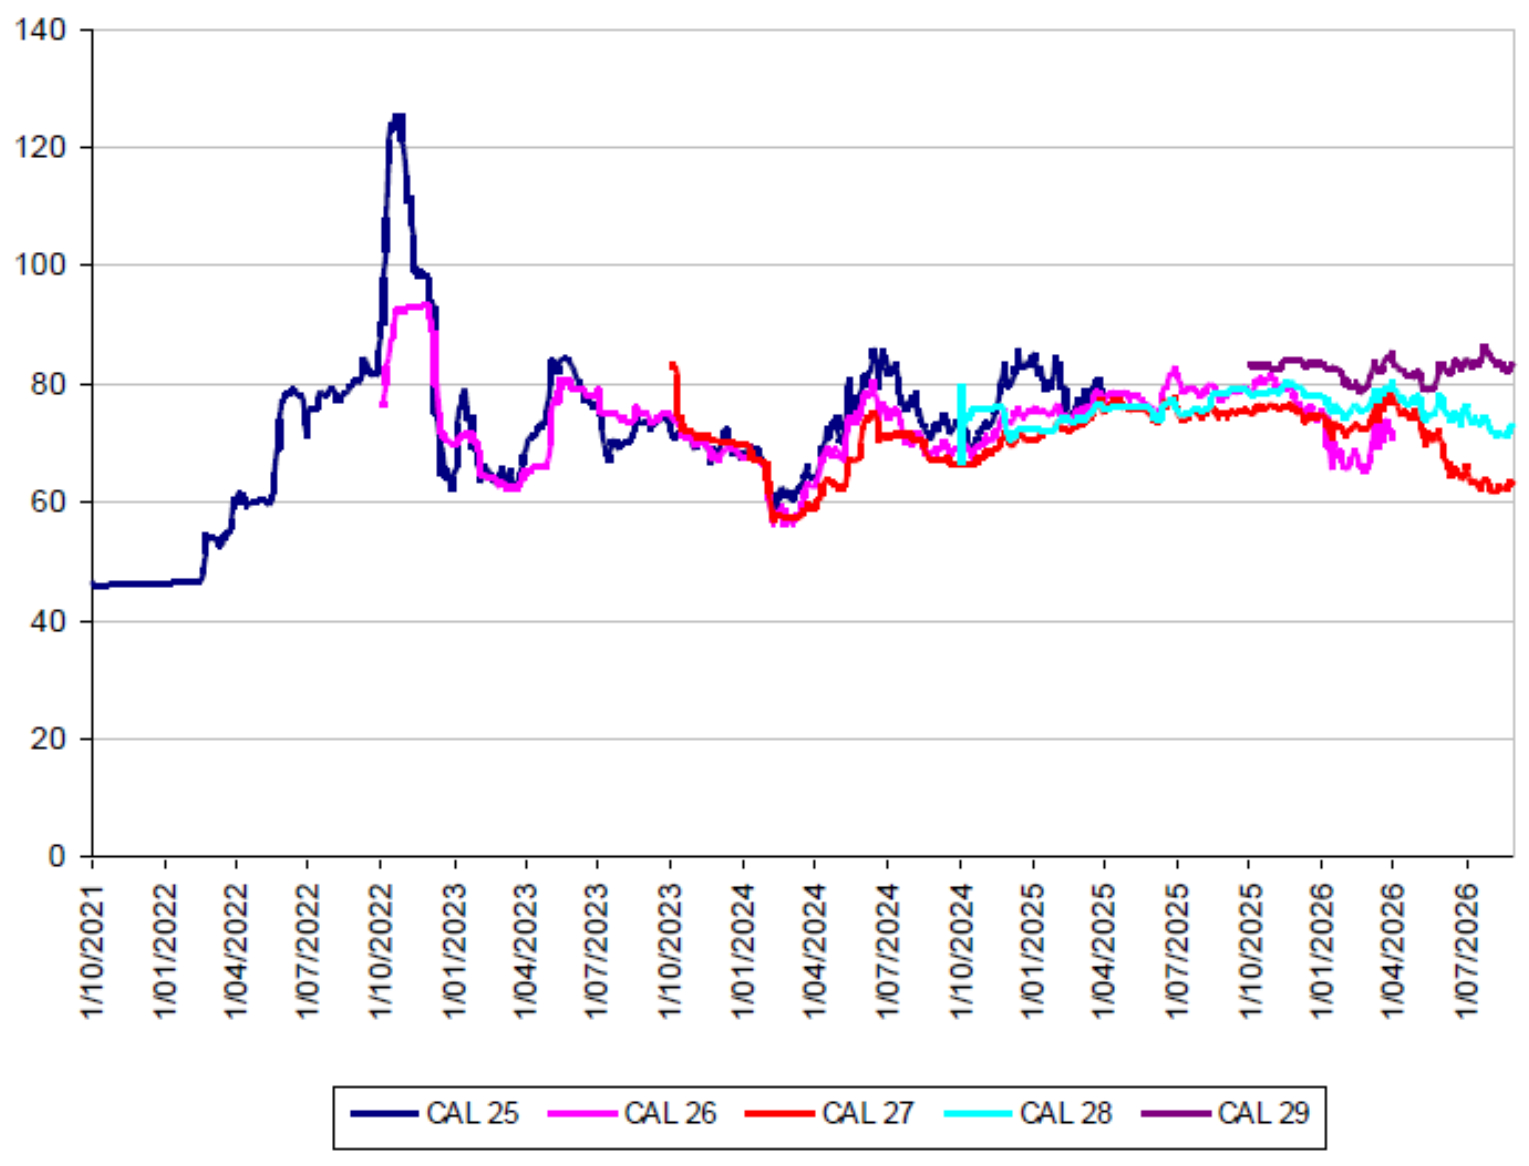
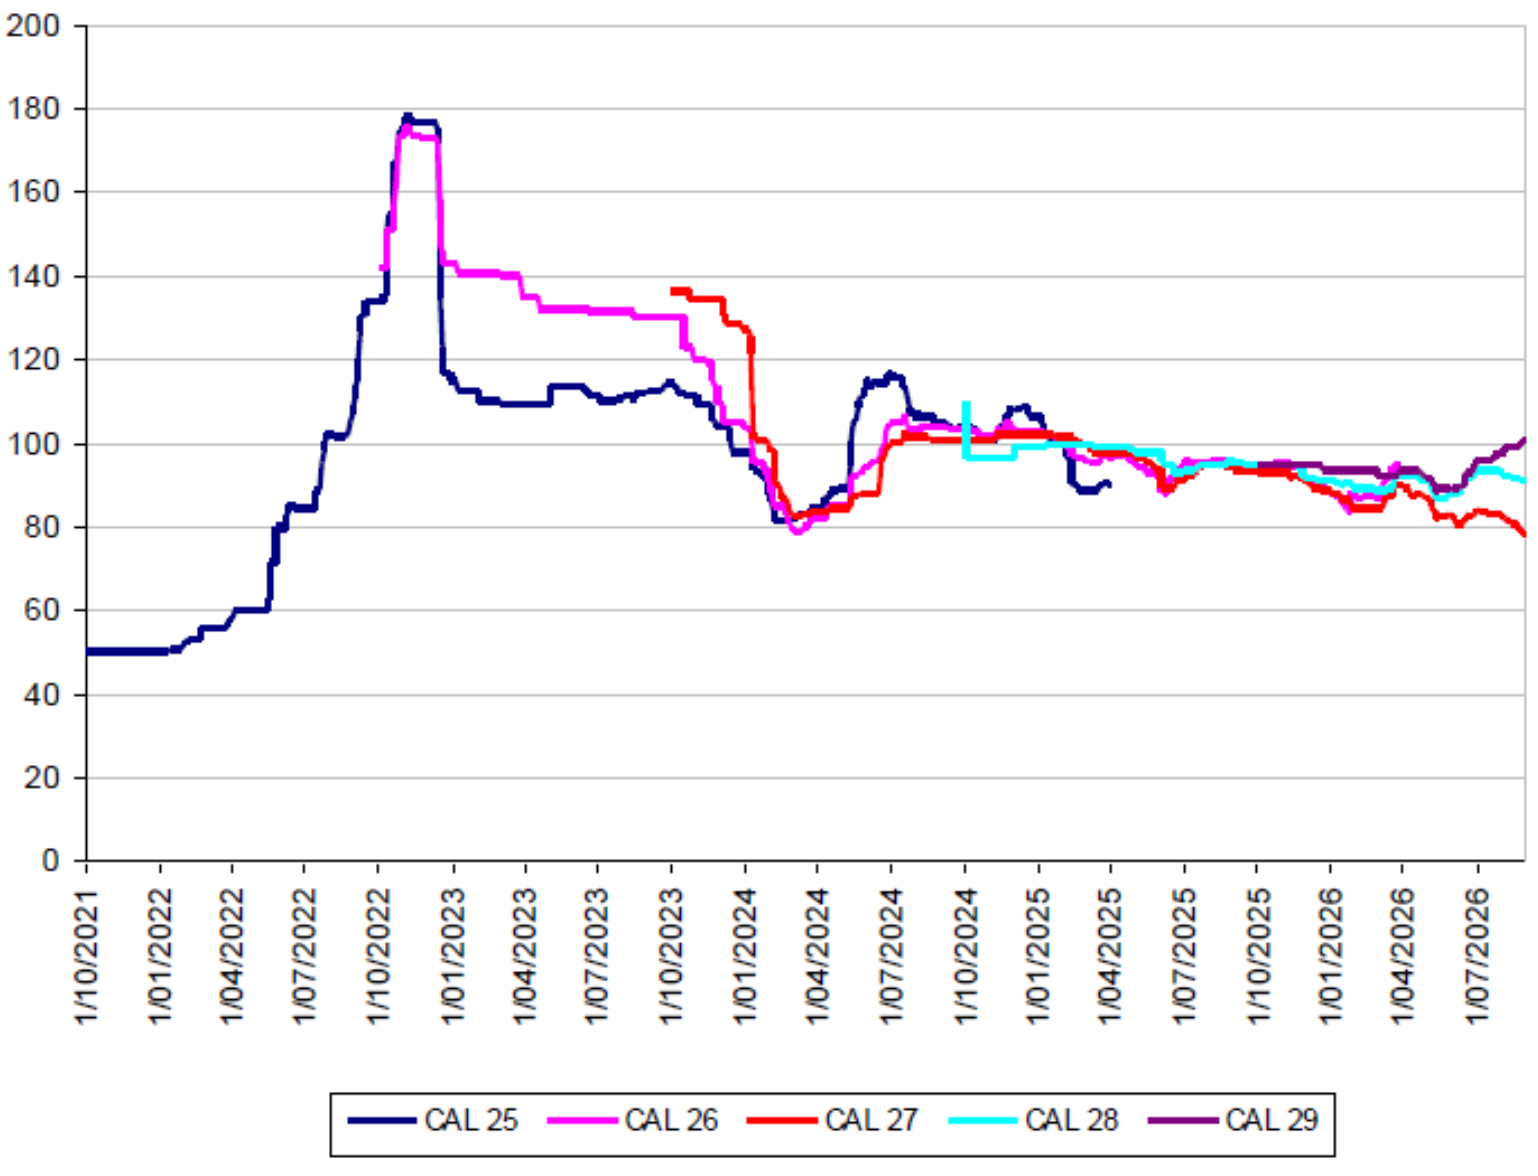
SA has less liquidity in the futures markets than other States, so changes tend to be lumpier and less a true reflection of the underlying market. For completeness we have included the graph below.
Calendar Year Contracts for South Australia
The Gas Market
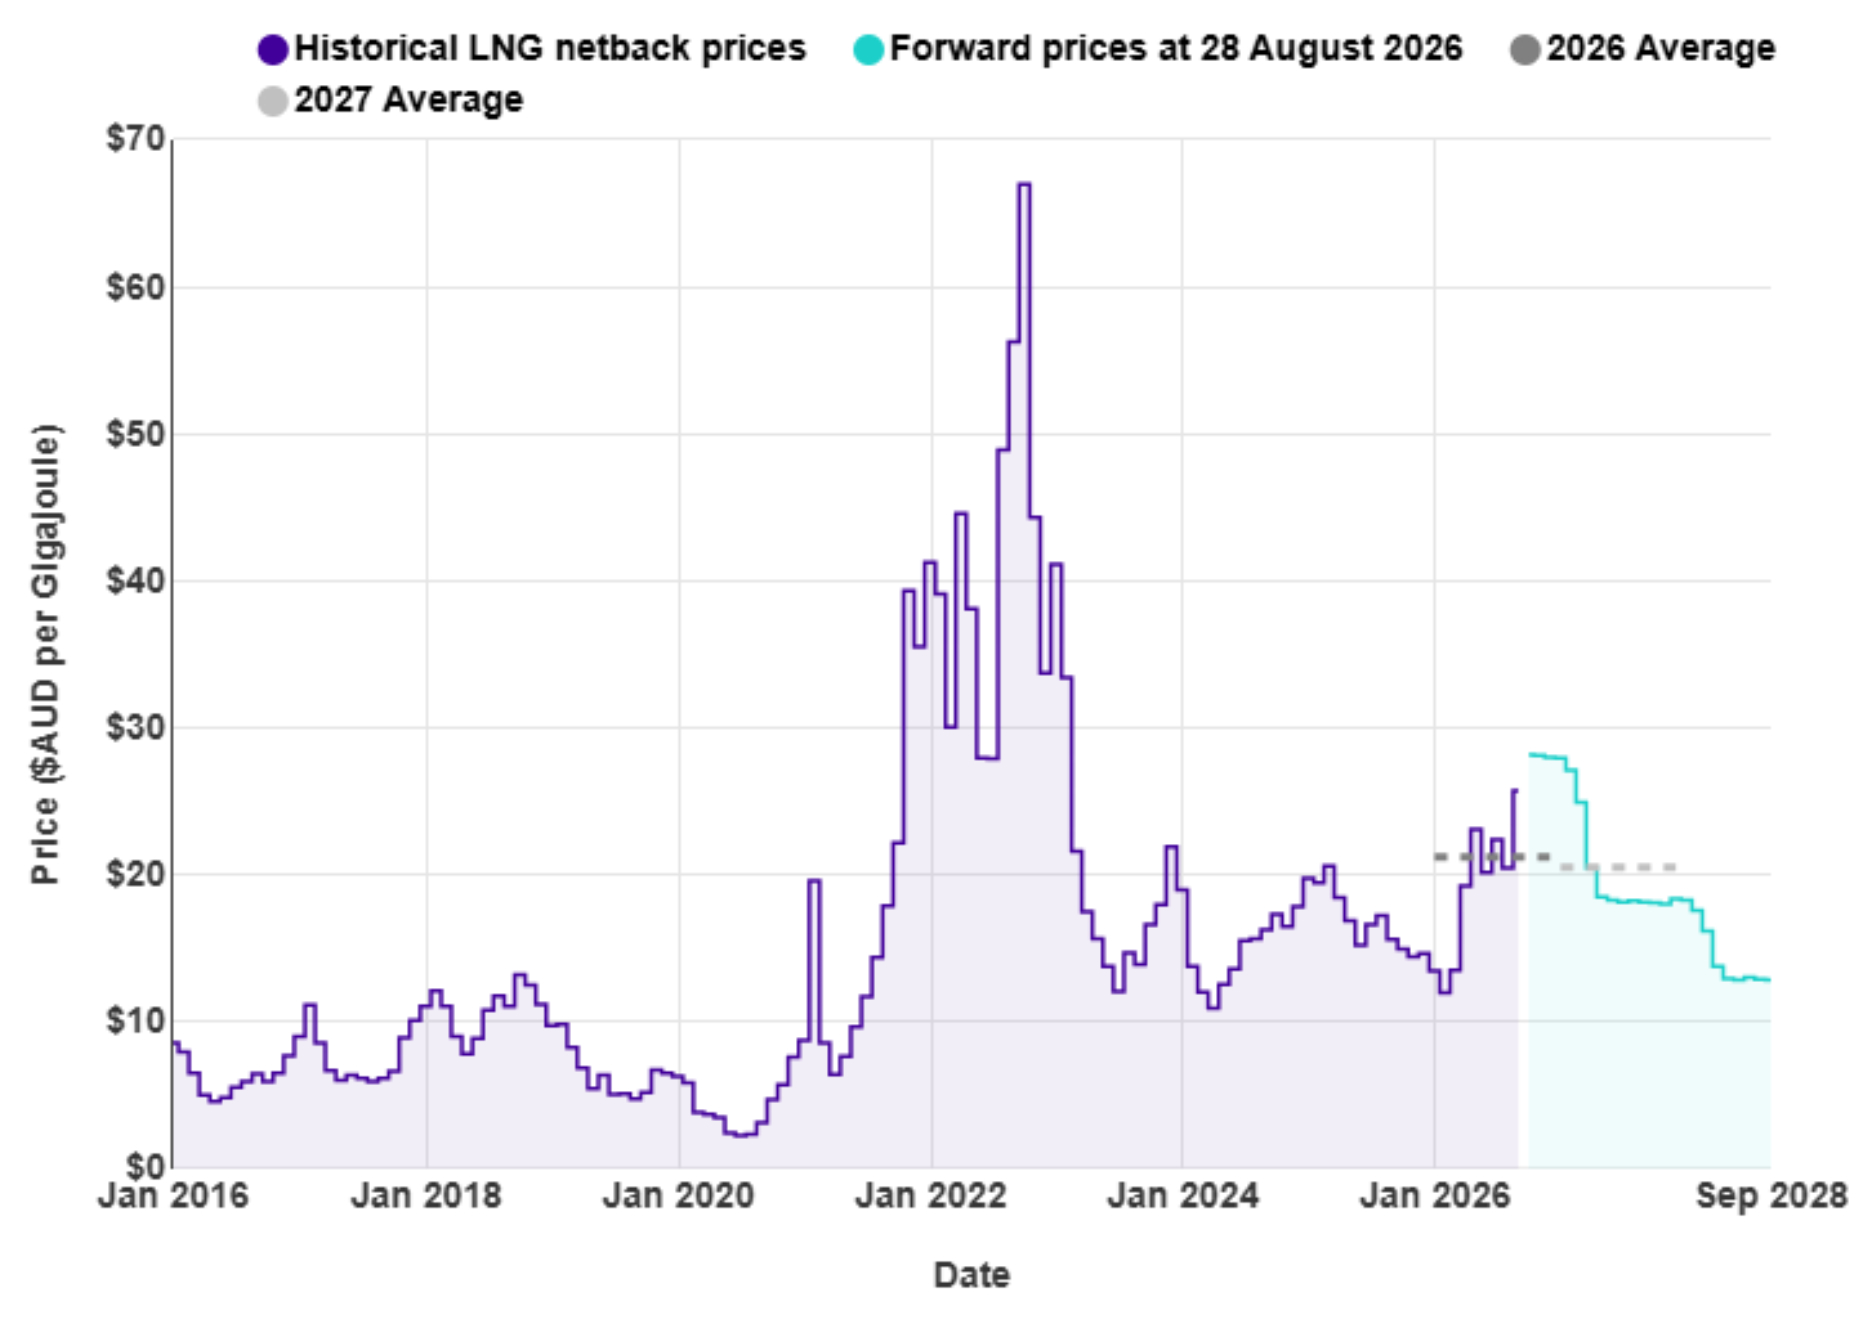
Internationally, LNG netback prices have increased on the conflict in the middle east. Prices in August increased 26% to $25.74/GJ. Forecast average prices for 2026 are currently $21.2/GJ and $20.52 for 2027. (Note that netback prices are indicative of international prices – they are produced by the ACCC and quoted in Australian dollars. They are net of the estimated costs to convert from pipeline gas in Australia to LNG, hence the term “netback”)
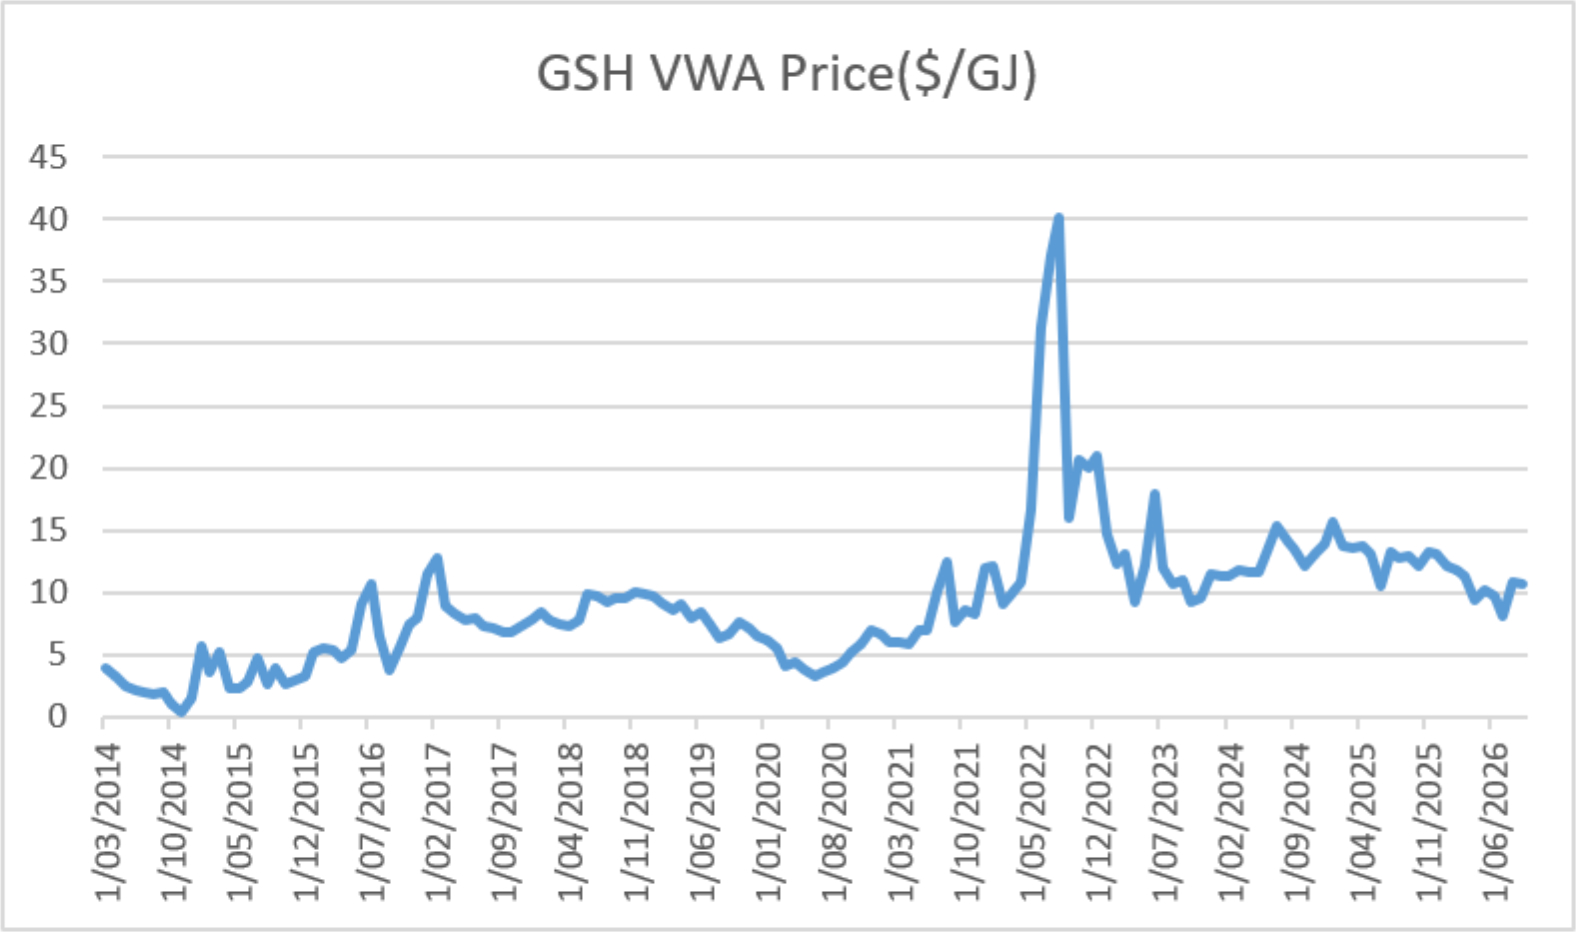
Domestic spot gas prices decreased slightly in August. The following graph shows the 30-day rolling average price at Wallumbilla gas supply hub – ending the month at $10.6/GJ, down 2% from July levels. This remains well below the LNG netback price. Prices are 18% below what they were the same time last year.
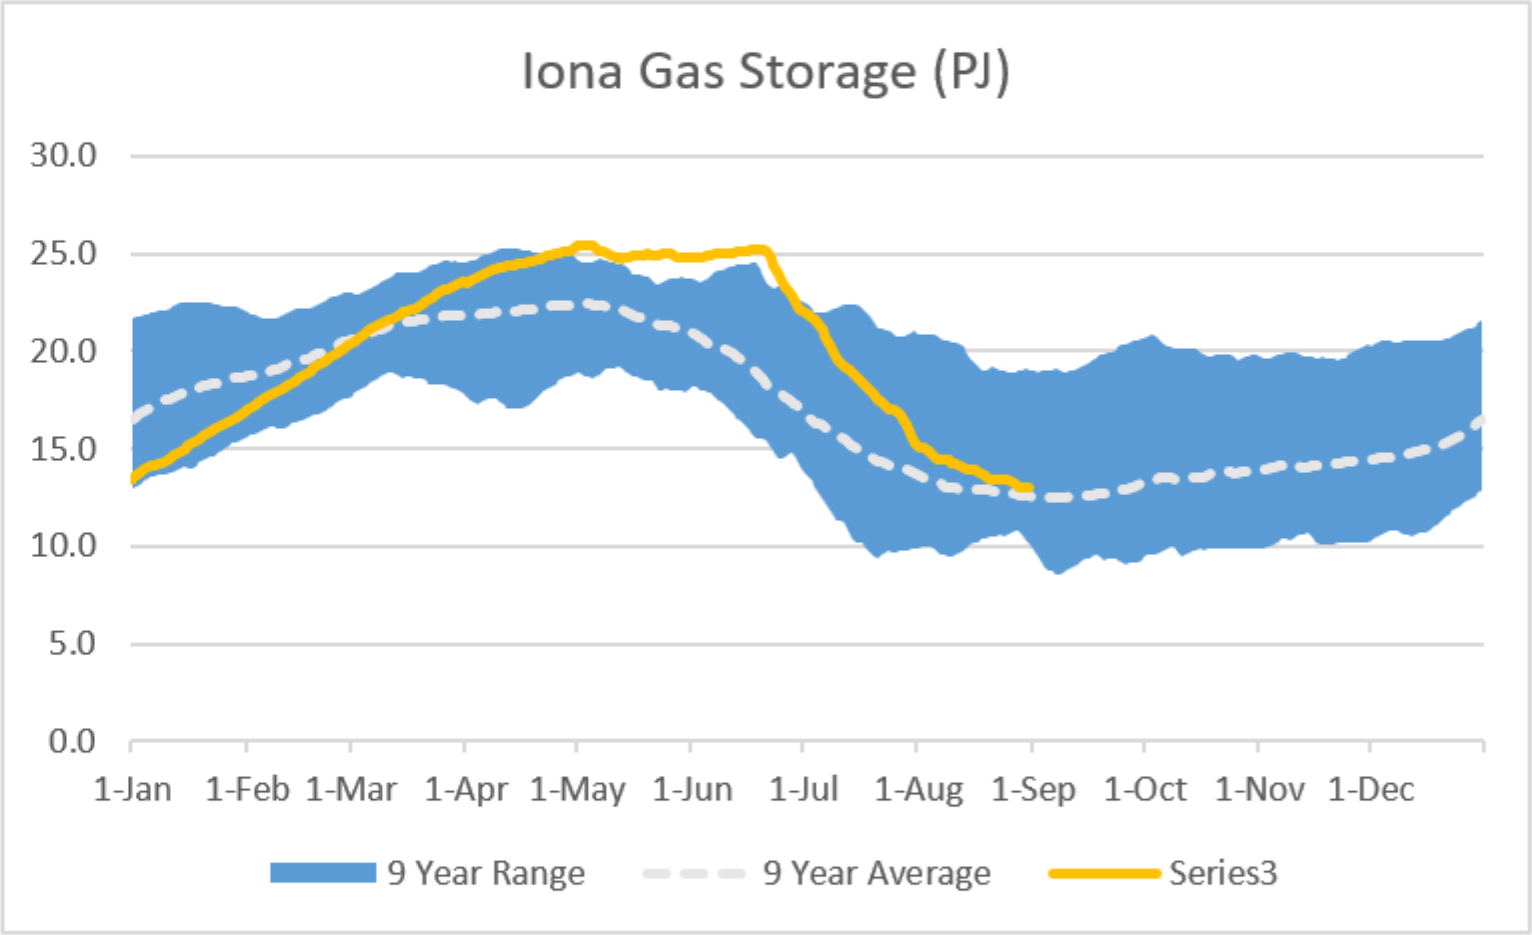
Gas storage at the key Iona storage facility continued to fall through August. Storage decreased to 13PJ – a 15% fall over the month. Storage is now close to the average level we have seen at this time of year for the past 9 years.
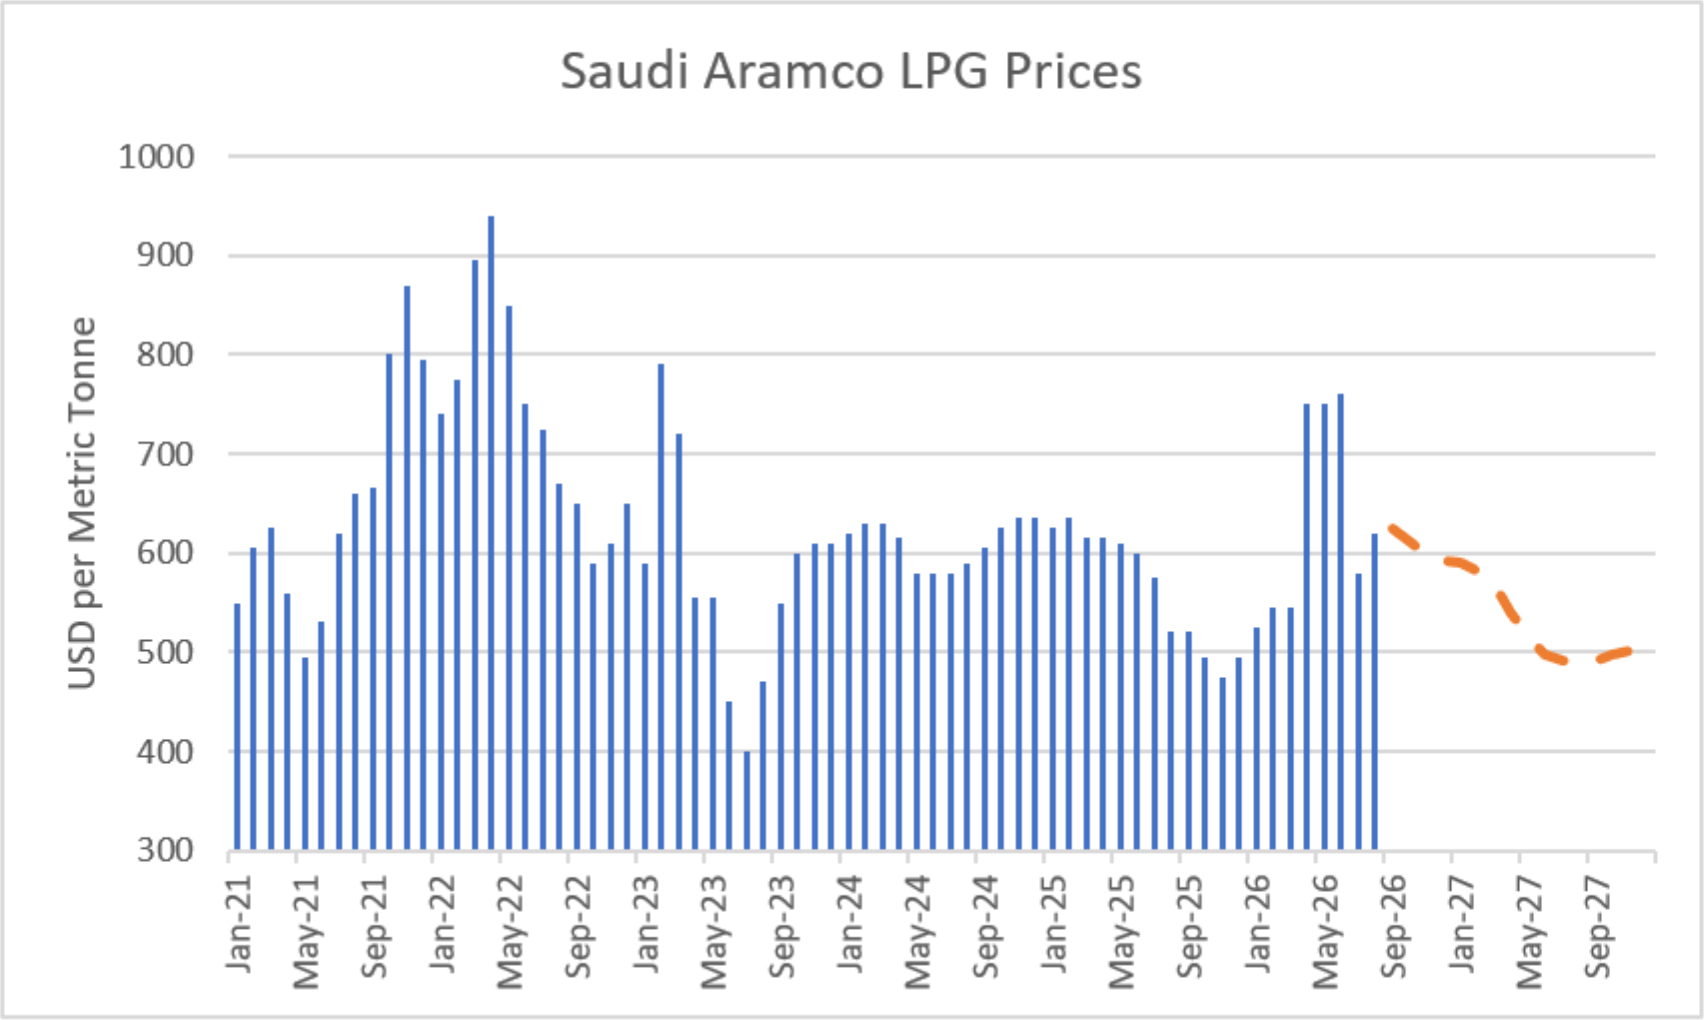
LPG is an important fuel for many large energy users, particularly in areas where reticulated natural gas is not available. The contract price of LPG is typically set by international benchmarks such as the Saudi Aramco LPG price – normally quoted in US$ per metric tonne.
The following graph shows the Saudi Aramco LPG pricing for the last 5 years as well as forecast pricing for the year and a half ahead. The war in the middle east caused prices to spike in Apr – Jun but they fell steeply in July before rising again in August. Futures prices increased through August.
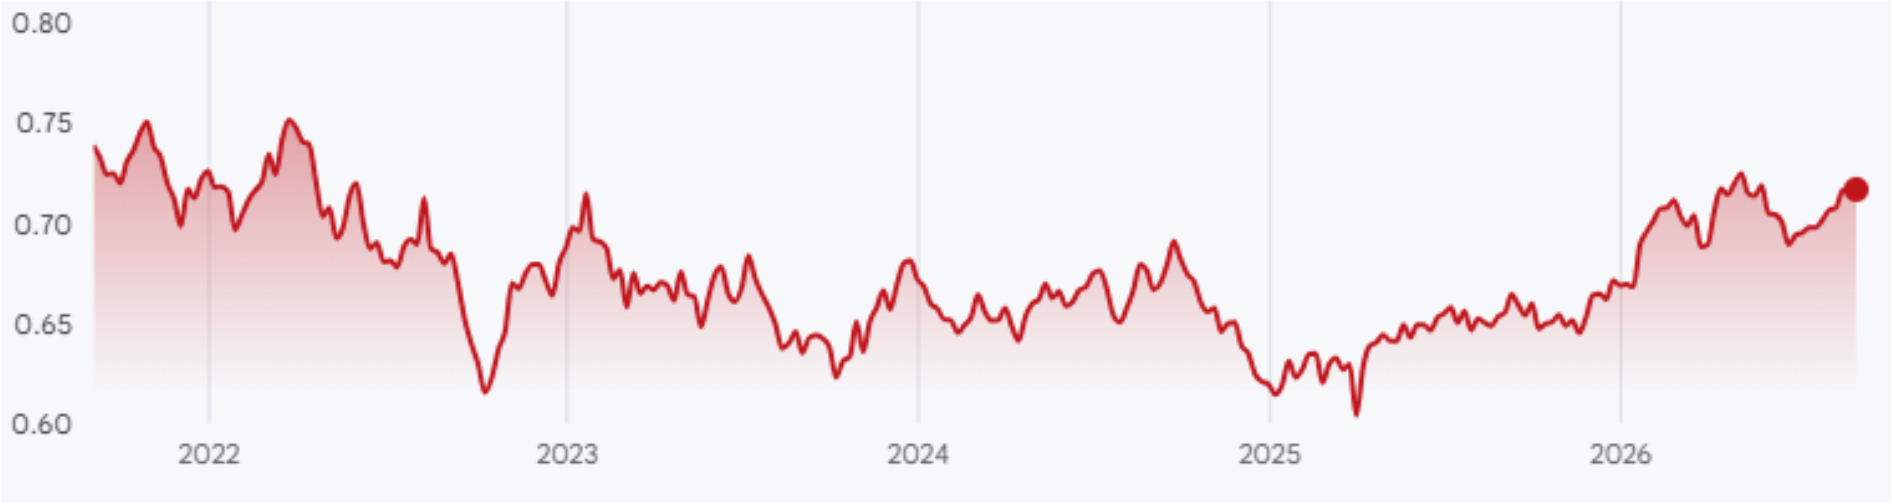
The other main contributing factor to LPG prices in Australia is the exchange rate against the USD. The exchange rate increased through the month closing at 0.72. This remains higher than we have seen in recent years and would tend to push down LPG prices when quoted in AUD.
The Coal Market
The conflict in the middle east has resulted in coal prices increasing along with other international energy commodities. To date the impact has not been as great as that observed during the initial years of the Ukraine war. Prices in August were flat for most of the month but jumped at the end of the month, ending the month at $142/tonne – up 7% as shown in the following graph of prices over the last 10 years.
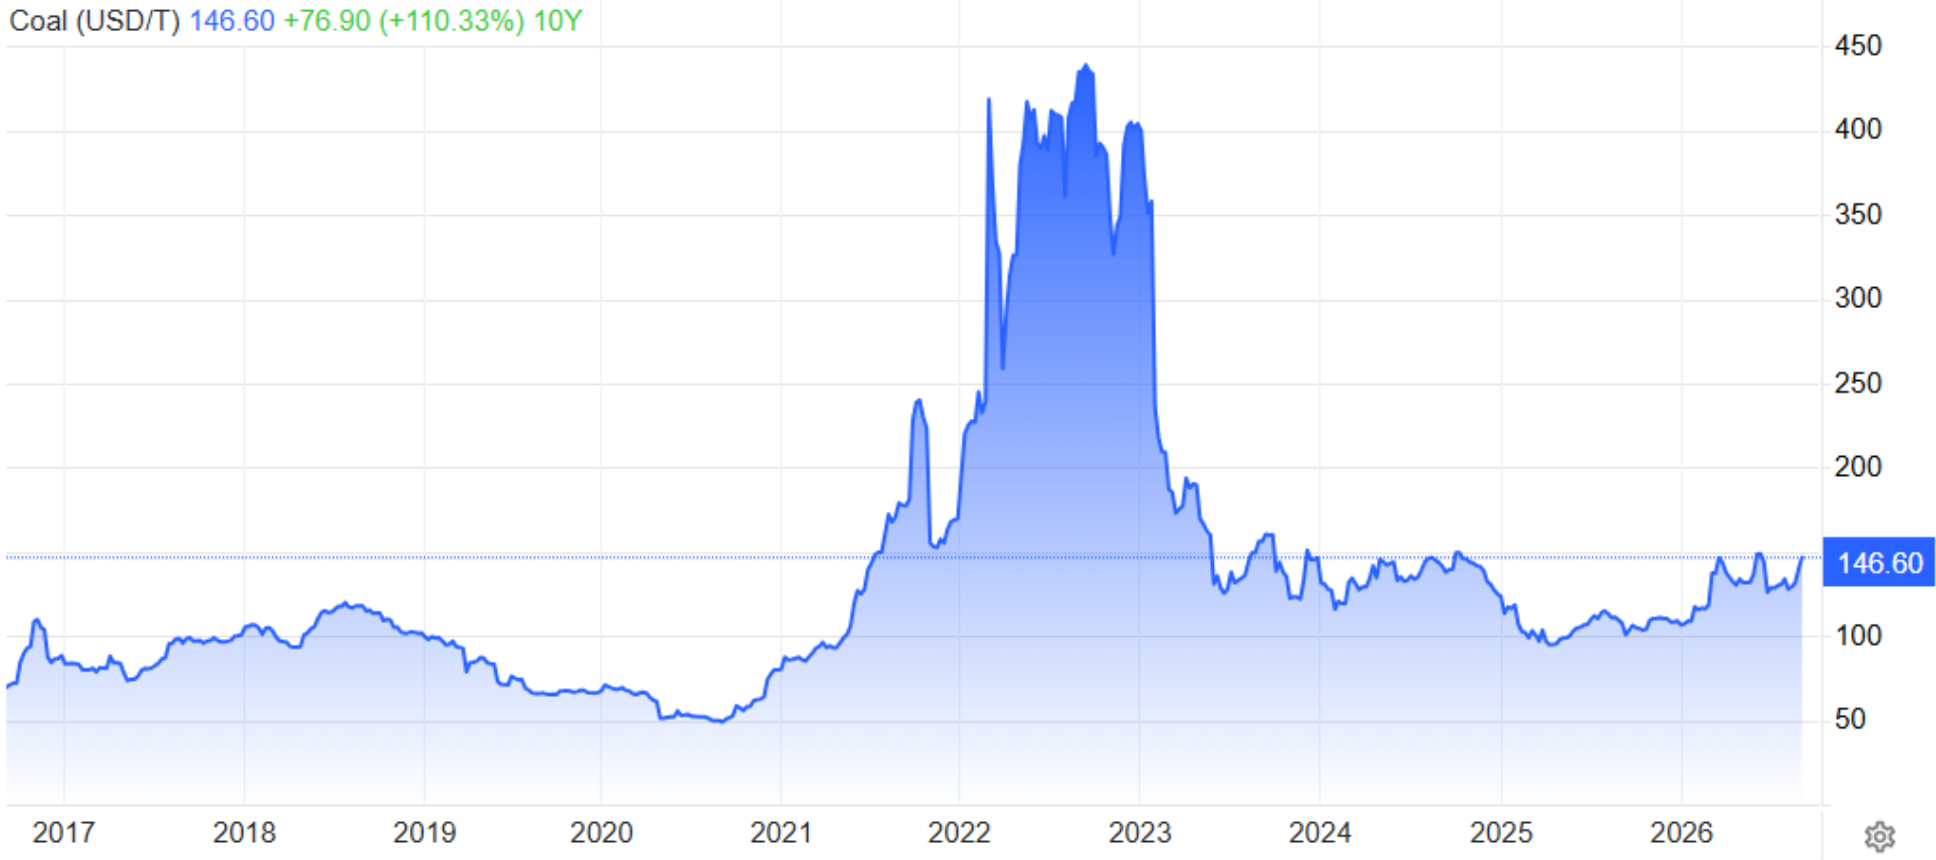
International coal prices continue to be an important driver of electricity prices especially in the States most reliant on black coal generation – ie QLD and NSW.
Environmental Certificates
The following graph shows environmental certificate spot prices over the last 6 years.
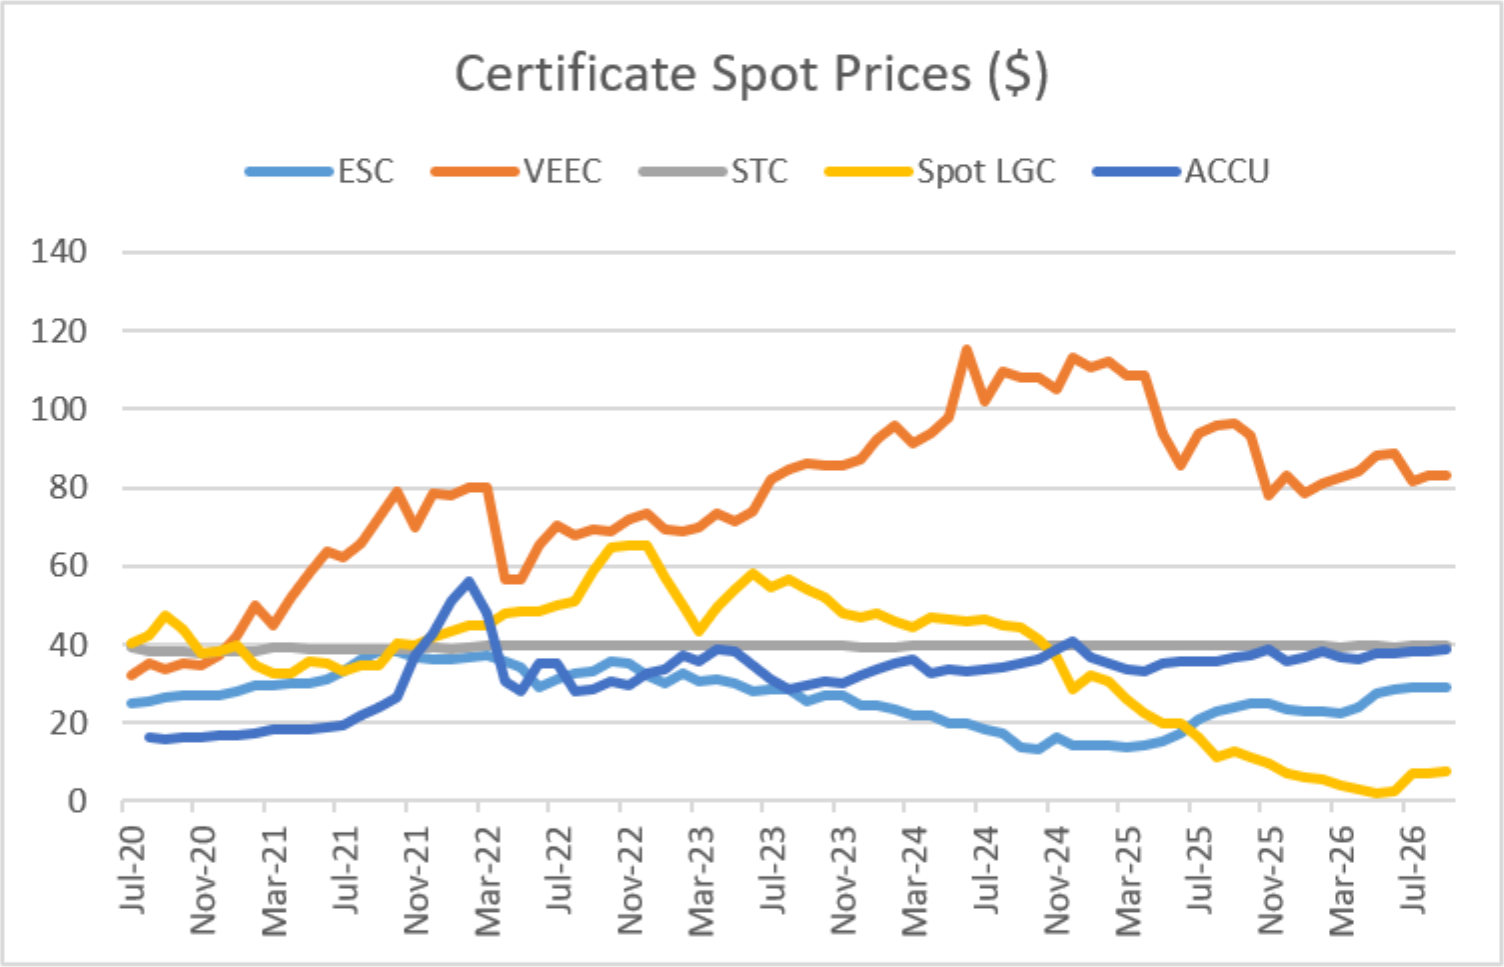
Spot LGC prices increased in August – up 9% to $7.75. ACCUs were up 2% at $38.95. ESCs and VEECs were unchanged at $29 and $83 respectively. STC’s fell marginally to $39.65.
Over recent months future dated LGC prices have increased from historically low levels. Prices for all future years currently sit in a narrow band between $7.5 and $9 a certificate and up about 25% on last month.

About this Report
This energy market summary report provides information on wholesale price trends for all regions within the National Electricity Market (NEM) and environmental scheme certificates.
Please note that all electricity prices are presented as a $ per MWh price and all certificate prices as a $ per certificate price.
All NEM spot prices are published by the Australian Energy Market Operator (AEMO). Futures contract prices are sourced from ASX.
Further information can be found at the locations noted below.
- NEM Spot market – AEMO publishes a range of detailed information which can be found here: https://aemo.com.au/Electricity/National-Electricity-Market-NEM/Data-dashboard
- Weather and Climate data – The Bureau of Meteorology publishes a range of weather related information which can be found here: http://www.bom.gov.au/climate/
Disclaimer
This document has been prepared for information and explanatory purposes only and is not intended to be relied upon by any person. This document does not form part of any existing or future contract or agreement between us. We make no representation, assurance or guarantee as to the accuracy of information provided. To the maximum extent permitted by law, none of Smart Power Utilities Ltd, its related companies, directors, employees or agents accepts any liability for any loss arising from the use of this document or its contents or otherwise arising out or, or in connection with it. You must not provide this document or any information contained in it to any third party without our prior consent.
© Copyright, 2026. Smart Power Utilities Ltd ABN 72 121 464 864


